How to read and interpret the temperature display during a 30-second extraction
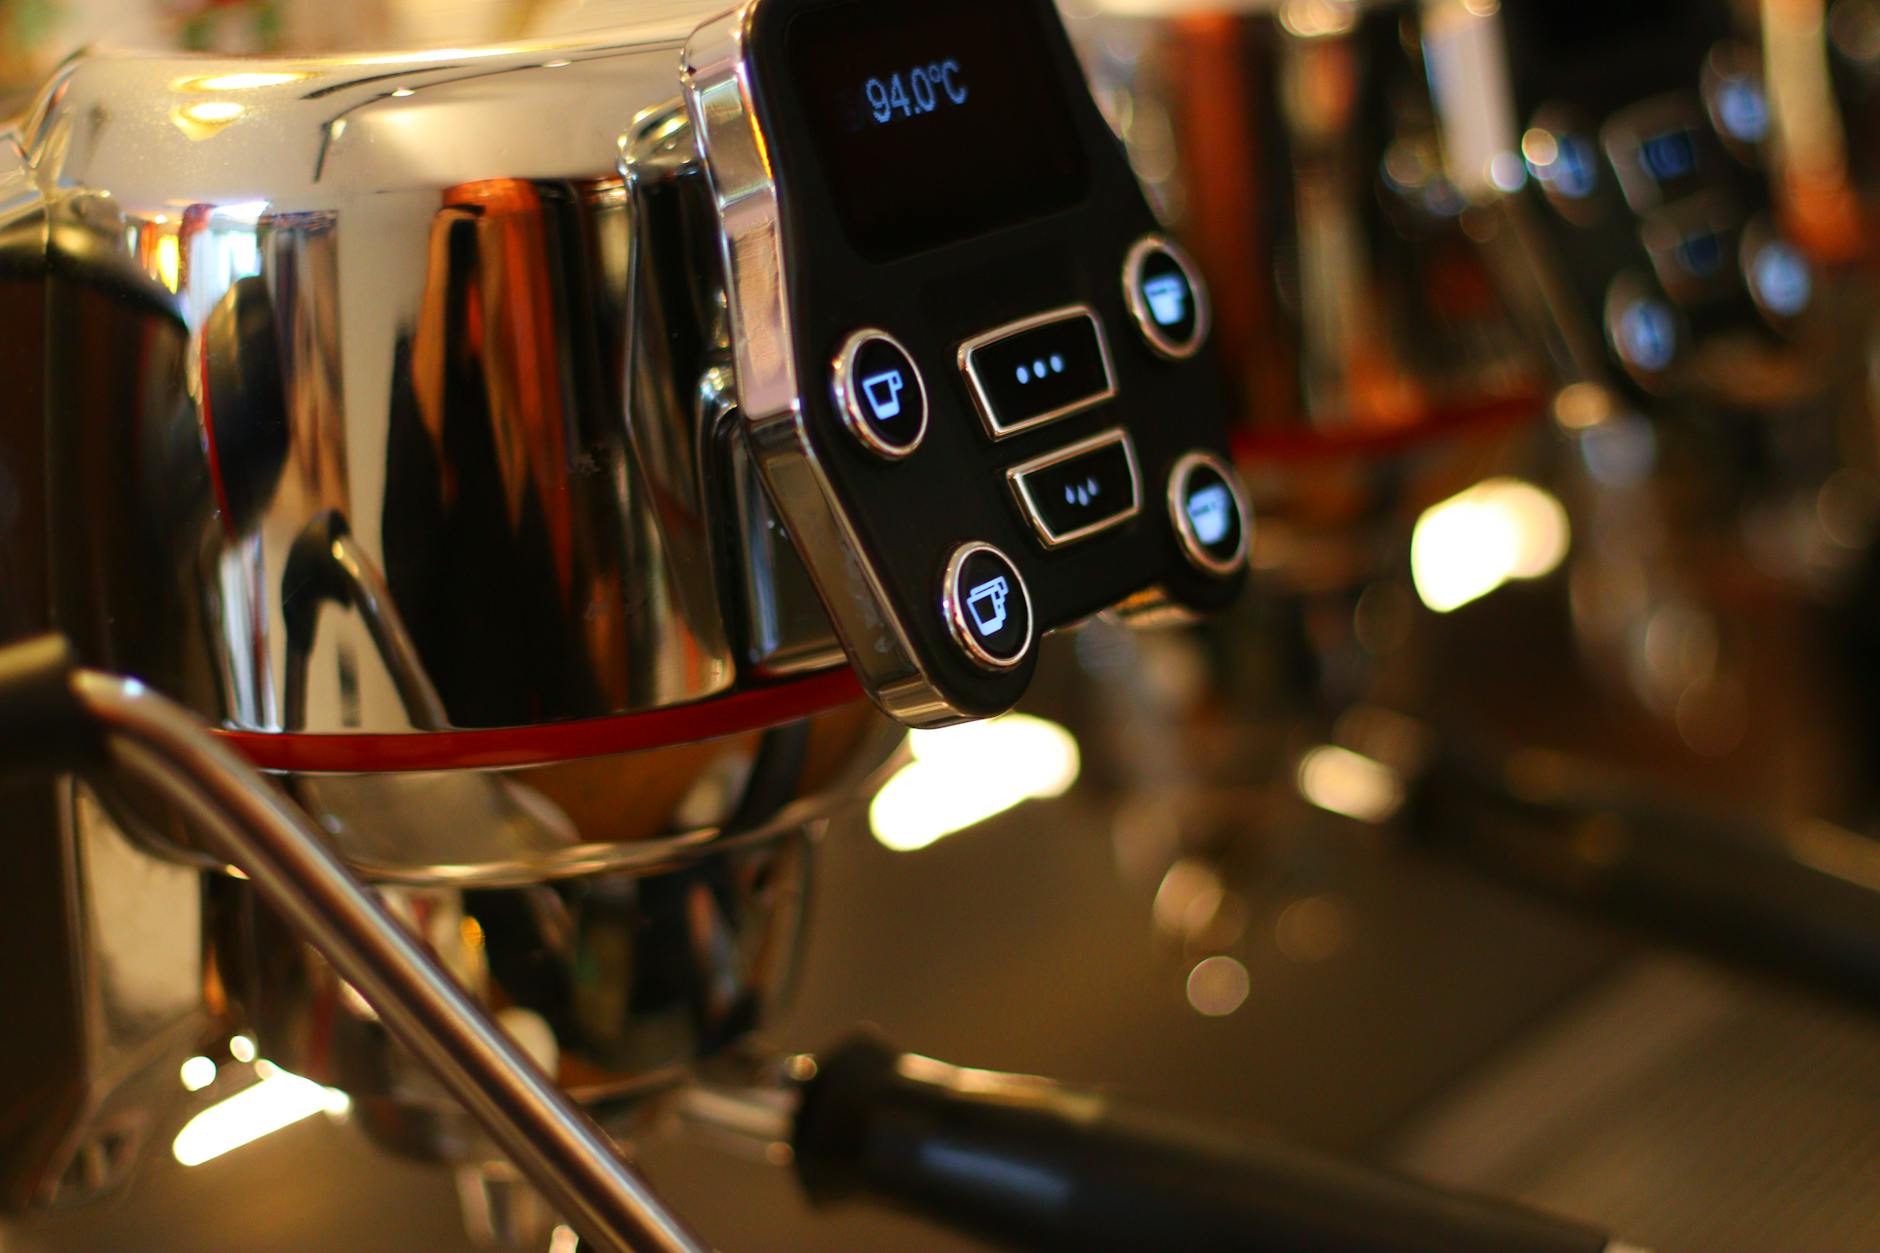
The pursuit of the perfect espresso shot is a journey of precision, where every variable counts. While we often focus on grind size and brew time, the temperature of your water is a silent, powerful force shaping the final taste in your cup. For baristas with modern machines, the digital temperature display is more than just a set-it-and-forget-it number; it’s a live feed of data from the heart of your extraction. Over the course of a 30-second shot, this display tells a story of stability, efficiency, and flavor potential. Understanding how to read and interpret these subtle fluctuations is a key skill that separates a good shot from a truly exceptional one. This guide will demystify the numbers, turning that blinking display into your most valuable tool for dialing in delicious espresso.
Understanding the temperature display: PID vs. traditional thermostats
Before we can interpret the numbers on the screen, it’s crucial to understand the technology behind them. Not all espresso machines manage heat in the same way. Older or more basic models often use a simple thermostat, which works like the one in your home oven. It turns the heating element on when the temperature drops below a certain point and off when it rises above it. This creates a wide temperature range, or “deadband,” where the water temperature can swing by several degrees. You might set it to 93°C, but the actual temperature could fluctuate between 90°C and 96°C.
A modern machine equipped with a PID (Proportional-Integral-Derivative) controller is a different beast entirely. A PID is a sophisticated feedback loop, a tiny computer dedicated to one task: maintaining thermal stability. It doesn’t just switch the heater on and off; it intelligently pulses power to the heating element, making constant, tiny adjustments to hold the temperature incredibly steady, often within a fraction of a degree of your set point. The number you see on the display of a PID machine isn’t just a target; it’s the actual, real-time temperature inside the boiler or at the group head. This precision is what allows us to analyze the extraction process in such detail.
The anatomy of a 30-second shot: A temperature timeline
A 30-second extraction is a dynamic event, and a PID display provides a second-by-second account of the thermal changes. Watching the display during the pull reveals a distinct pattern. Let’s break down the journey:
- Seconds 0-8 (Pre-infusion and initial flow): When you start the shot, the pump introduces room-temperature water into the system to saturate the coffee puck. This causes an initial, and entirely normal, temperature drop. You might see your display dip by 1-2°C (2-4°F) as the cold water mixes with the hot water in the group head. A powerful machine will show its PID controller immediately working to counteract this, and the temperature will start to climb back toward your set point.
- Seconds 9-25 (The heart of the extraction): This is the most critical phase. Here, your machine should demonstrate its thermal stability. On a well-designed machine, the temperature on the display should hold very steady, fluctuating by no more than +/- 0.5°C (1°F) from your target. This stability ensures that the coffee is being extracted evenly, bringing out the balanced flavors you’re looking for. This is the period that has the greatest impact on taste.
- Seconds 26-30 (Finishing the shot): As the shot concludes, you may see a very slight temperature change. On some machines, it might creep up a fraction of a degree as the flow rate through the puck increases and the heater catches up. On others, it might hold perfectly steady. A significant drop or spike at this stage is less common but can indicate the limits of the machine’s heating capacity.
Interpreting the data: What the numbers are telling you
Now that you can follow the temperature timeline, you can start diagnosing your shot based on the data. The display provides direct feedback that links your equipment’s performance to the taste in the cup. A stable reading is the goal, but deviations from that ideal are incredibly informative. They can tell you if a sour or bitter taste is due to your recipe or your machine’s behavior.
For example, a significant temperature drop that doesn’t recover quickly during the main extraction phase is a classic sign of a machine struggling to keep up. This “temperature surfing” leads to under-extraction, producing sour, thin, and acidic coffee. Conversely, a temperature that continuously rises or “overshoots” the target can scorch the coffee grounds, resulting in bitter, ashy, and overly astringent flavors. By watching the display, you can confirm these issues and take steps to correct them, rather than endlessly adjusting your grind size.
| Temperature Behavior During Extraction | Potential Taste Defect | Possible Cause & Solution |
|---|---|---|
| Stable Temperature (e.g., holds at 93°C +/- 0.5°C) |
Balanced, consistent, predictable flavor. | Ideal performance. Your machine has good thermal stability. Now you can focus on adjusting grind, dose, and yield. |
| Significant Drop (e.g., drops from 93°C to 90°C and stays there) |
Sour, acidic, under-extracted. | Machine struggling with heat recovery. Try waiting longer between shots or flushing less water before the pull. |
| Creeping Rise / Overshoot (e.g., starts at 93°C and climbs to 95°C) |
Bitter, astringent, burnt. | PID may be tuned too aggressively or the machine is overheating. On a heat-exchanger machine, this may require a longer cooling flush. |
Using temperature data to dial in your shot
Observing the temperature display isn’t a passive activity; it’s an active part of the dialing-in process. This data empowers you to make informed decisions to improve your coffee. The first and most obvious step is adjusting your target temperature based on the coffee beans you’re using. As a general rule, darker roasts benefit from slightly lower temperatures (e.g., 90-92°C / 194-198°F) to minimize bitterness and extract rich, chocolatey notes. Lighter, more acidic roasts often shine at higher temperatures (e.g., 93-96°C / 199-205°F), which help to unlock their delicate floral and fruity flavors.
Beyond recipe adjustments, consistent temperature instability can be a diagnostic tool for your machine. If you notice performance has degraded and the display shows wilder swings than it used to, it could be an early warning sign. This might indicate a buildup of scale on the heating element, which insulates it and reduces its efficiency, or a failing temperature probe. Paying attention to these trends can help you address maintenance issues before they become serious problems, ensuring your equipment continues to perform at its best.
The temperature display isn’t just a static setting; it’s a dynamic gauge that reflects the health and performance of your espresso machine during its most critical moments. By learning to read this data, you move beyond simply following a recipe and begin to truly understand the science of extraction. From identifying the cause of a sour shot to fine-tuning the profile for a delicate light roast, the information is right there on the screen. The next time you pull a shot, don’t just watch the clock. Watch your temperature display. It tells a story of thermal stability and flavor that will empower you to make smarter adjustments, diagnose problems, and ultimately, brew a consistently better cup of coffee.


 No products in the cart.